(1)在ADAMS窗口上方的Build菜单中选择“Measure→Point to Point→New”,如图7-30所示。
(2)系统打开参数设置对话框,如图7-31所示。为测量输入一个名字,如rdot。在ToPoint栏中输入“MARKER_8”,即滑块左侧铰接点处大地的标记点;在FromPoint栏中输入“MARKER_10”,即曲柄与活塞的连接点。
(3)在Characteristic栏选择Translationl velocity以测量其速度。
(4)选择Cylindrical(圆柱)坐标系,并选择R选项。
(5)设置完毕单击Apply按钮,弹出测量窗口,如图7-32所示。
(6)重复(1)~(3)步骤新建测量r_doubledot,在Characteristic栏选择Translation acceleration以测量加速度,测量结果如图7-33所示。
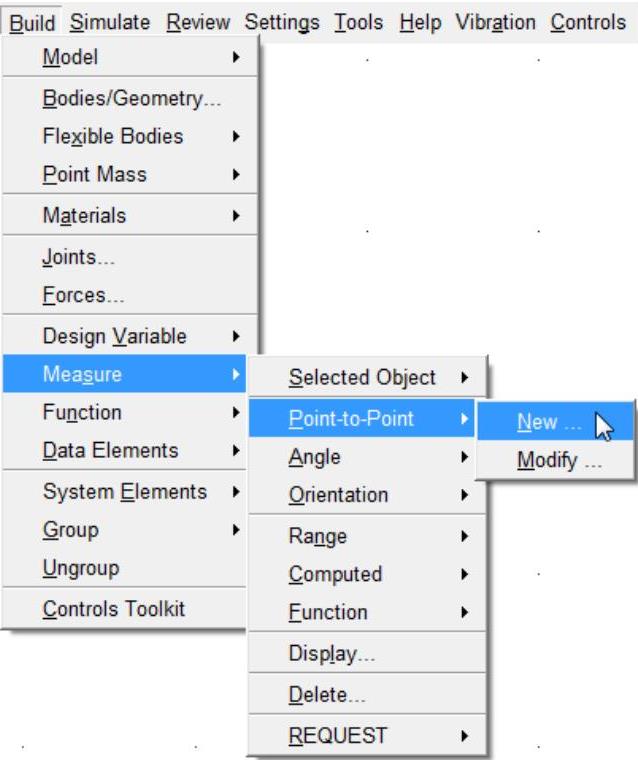
图7-30 Build菜单
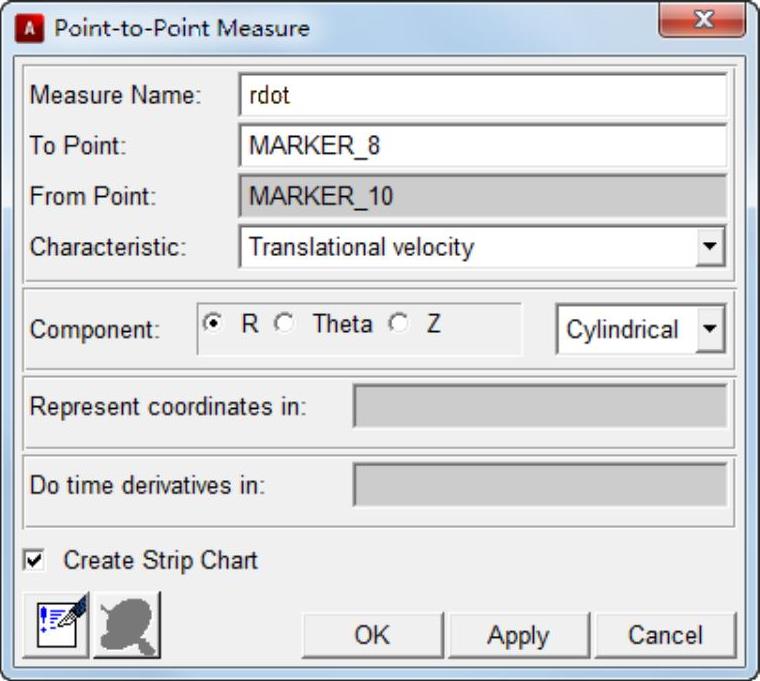
图7-31 测量rdot
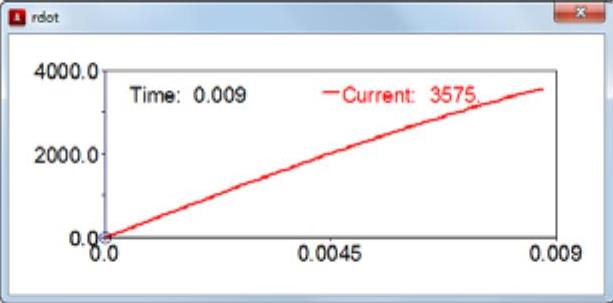
图7-32 rdot测量曲线
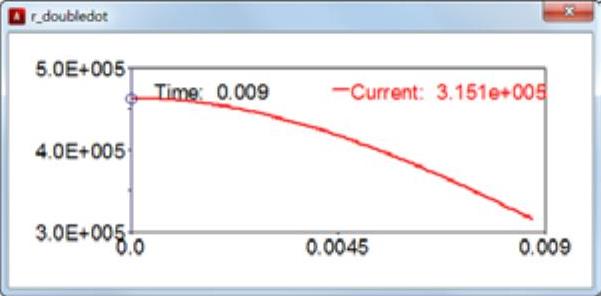
图7-33 r_doubledot测量曲线
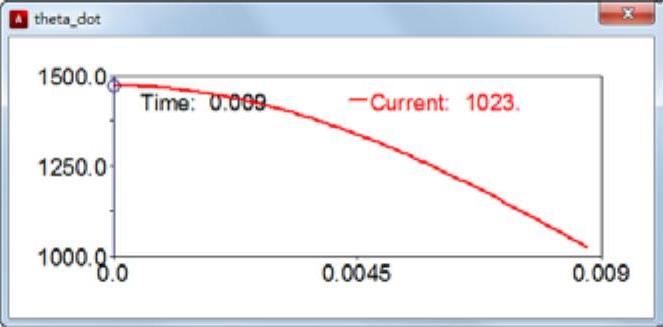
(7)重复(1)~(3)步骤新建测量theta_dot,在Characteristic栏选择Translation velocity测量速度以及theta选项,测量结果如图7-34所示。
(8)重复(1)~(3)步骤新建测量theta_doubledot,在Characteristic栏选择Translation acceleration测量加速度以及theta选项,测量结果如图7-35所示。
 (https://www.xing528.com)
图7-34 theta_dot测量曲线
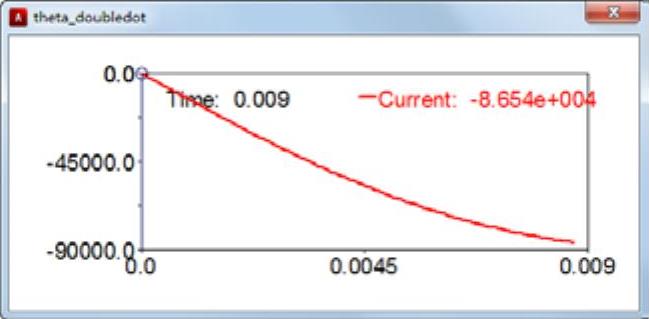
图7-35 theta_doubledot测量曲线
用鼠标右键单击每个测量窗口,选择“transfer to full plot”命令,进入ADAMS/PostProcessor窗口,放大整个测量曲线,单击Plot Tracking图标 可以得到在不同时刻各测量点的精确数值。通过该仿真曲线,可以得到:
■rdot=3.575m/s(注意图中的单位是mm/sec),如图7-36所示。
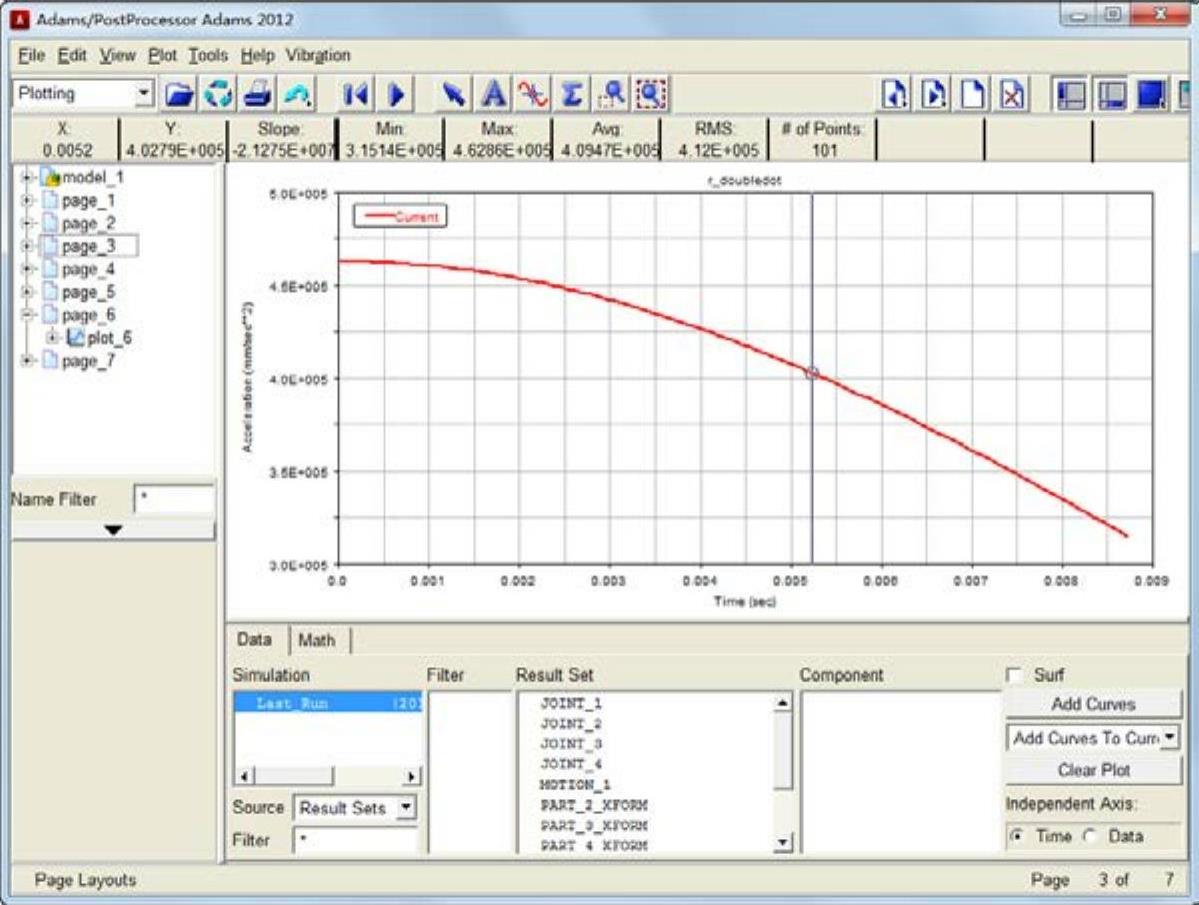
图7-36 rdot测量曲线
■r_doubledot=315.11m/s^2,如图7-37所示。
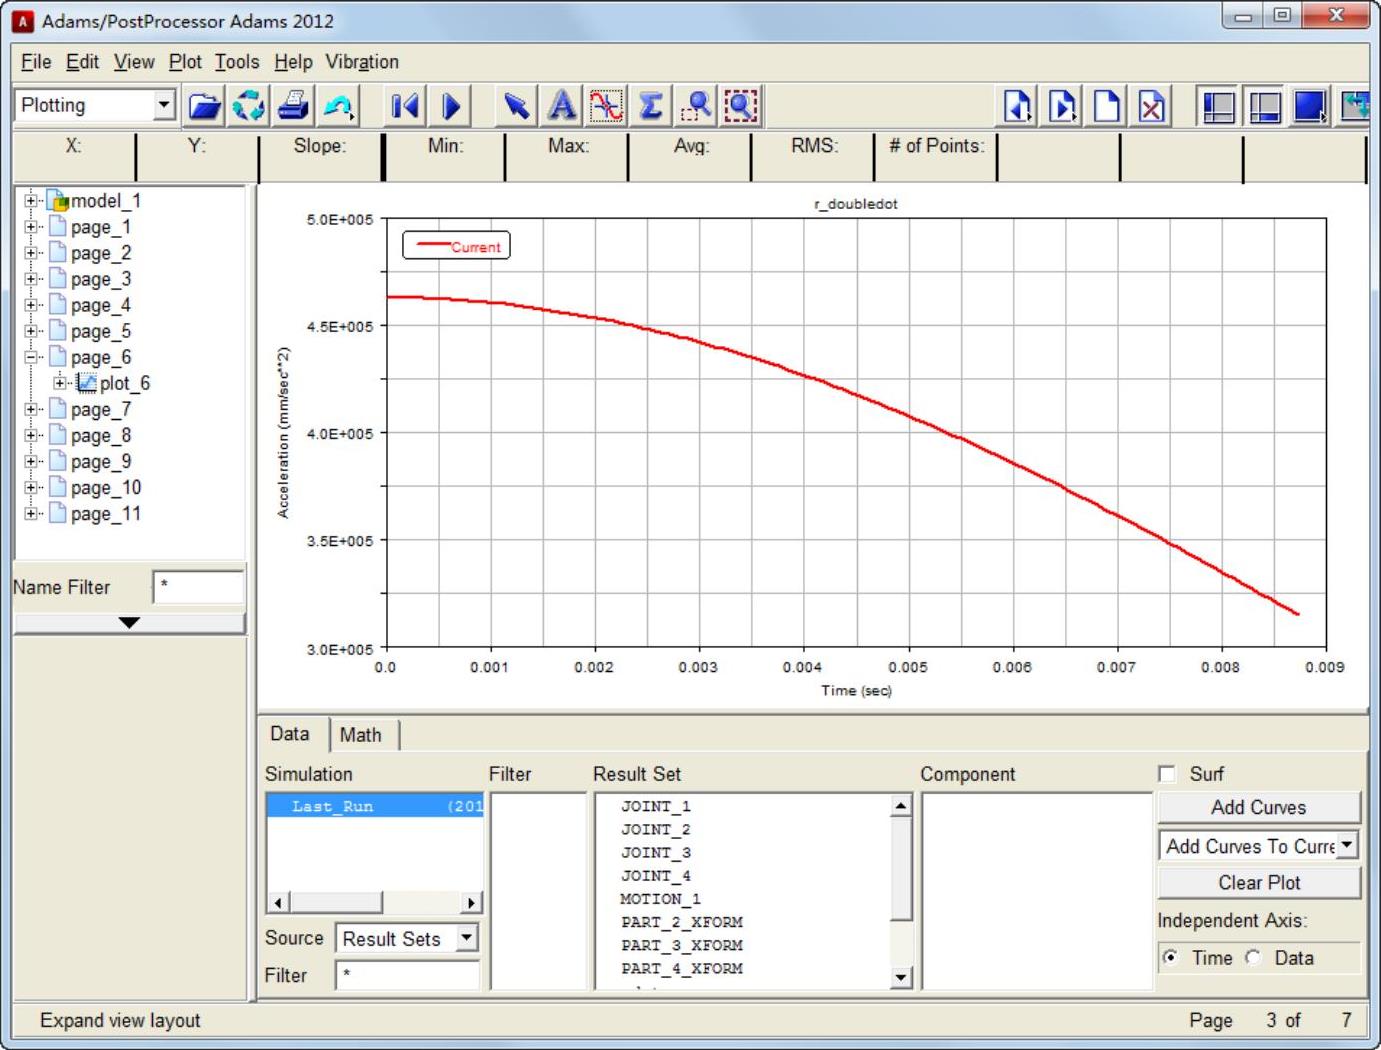
图7-37 r_doubledot测量曲线
■theta_dot=1023.4deg/second=17.86rad/s,如图7-38所示。

图7-38 theta_dot测量曲线
■theta_doubledot=-86542.26deg/s=-1510.45rad/s,如图7-39所示。

图7-39 theta_doubledot测量曲线
免责声明:以上内容源自网络,版权归原作者所有,如有侵犯您的原创版权请告知,我们将尽快删除相关内容。


