 读入计算结果:依次选择Main Menu→General PostProc→Read Results→Last Set,读取最后一个迭代的计算结果。
 绘制流场的速度分布图:依次选择Main Menu→General PostProc→Plot Results→Vector Plot→Predefined,会弹出“Vector Plot of Predefined Vectors”对话框,如图5-134所示。在对话框中选择“DOF Solution→Velocity V”,单击“OK”按钮,会得到流场的速度分布图,如图5-135所示。
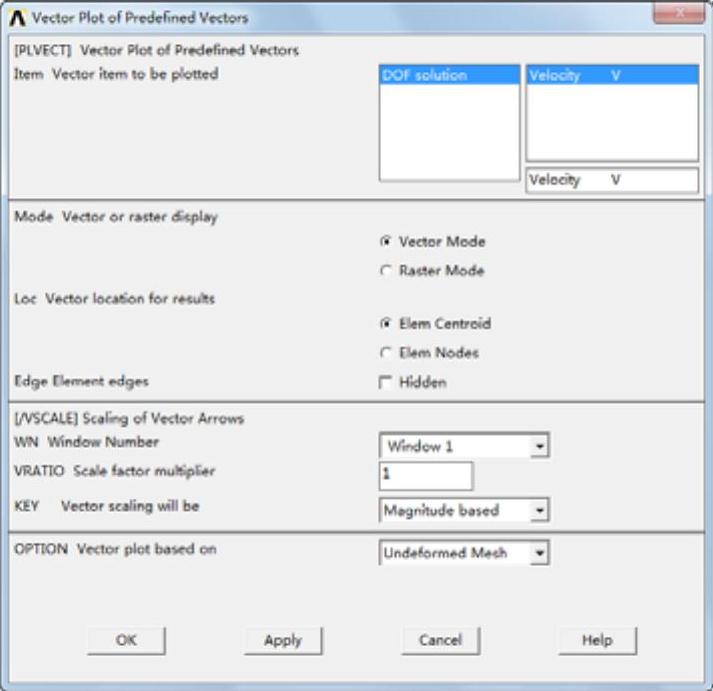
图5-134 “Vector Plot of Predefined Vectors”对话框
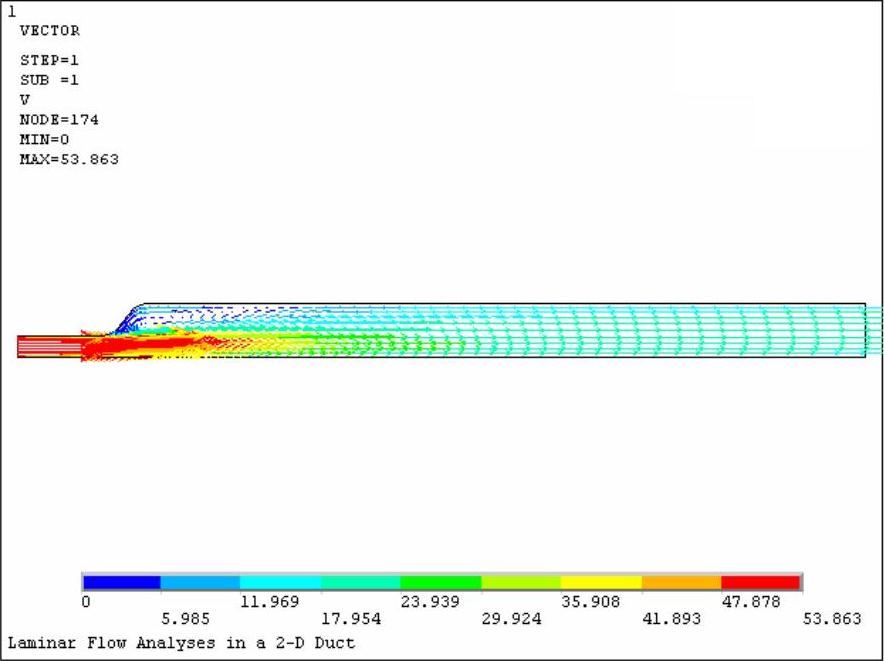
图5-135 流场的速度分布图
 绘制流场的总压力(静压和动压)分布图:依次选择Main Menu→General PostProc→Plot Results→Contour Plot→Nodal Solution,会弹出“Contour Nodal Solution Data”对话框,如图5-136所示。在对话框中选择“Other FLOTRAN Quantities→Total stagnation pressure”,单击“OK”按钮,会得到流场的总压力(静压和动压)分布图,如图5-137所示。
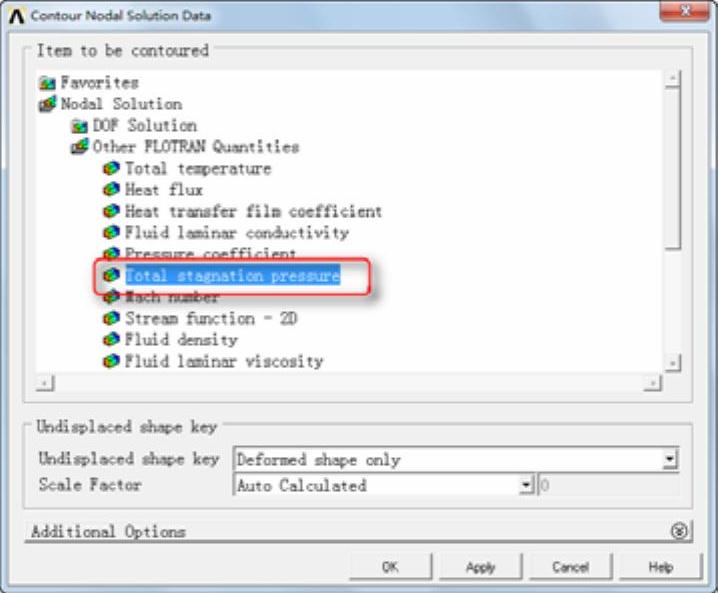
图5-136 “Contour Nodal Solution Data”对话框
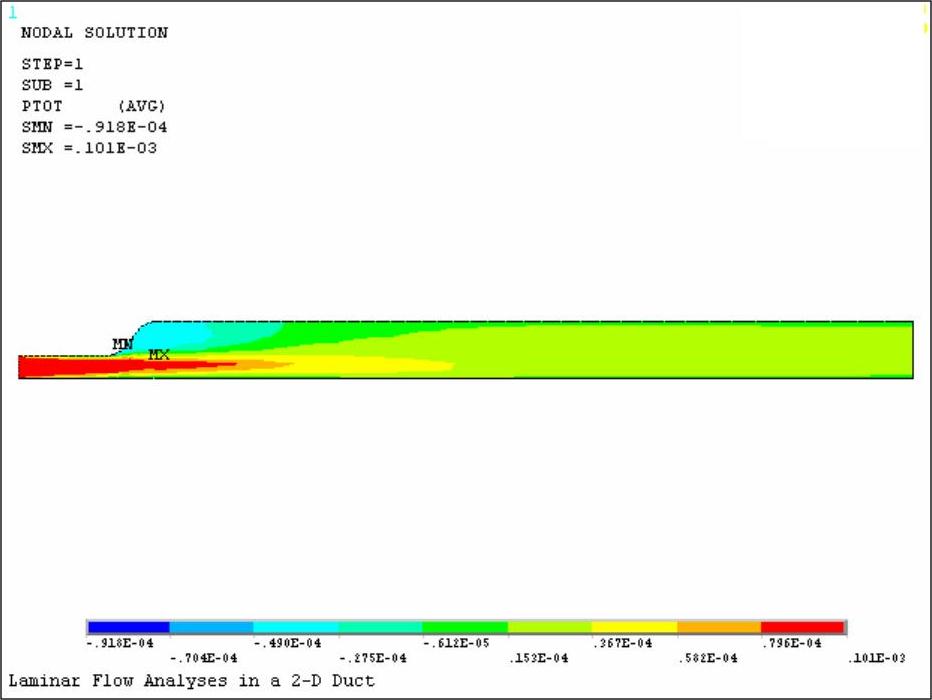
图5-137 流场的总压力分布图
 获得流体质点的运动轨迹动画:依次选择Main Menu→General PostProc→Plot Results→Defi Trace Pt,会弹出“拾取”对话框。拾取如图5-138所示的几个点(大概位置就可以),单击“OK”按钮关闭对话框。

图5-138 选取的点
 依次选择Utility Menu→PlotCrls→Animate→Particle Flow,会弹出“Animate Flow Trace”对话框,如图5-139所示。在对话框中选择“DOF solution→Velocity VX”,单击“OK”按钮,会得到流体质点的运动轨迹动画。(https://www.xing528.com)
 绘制出口处的流速分布:依次选择Main Menu→General PostProc→Path Operation→Define Path→By Nodal,会弹出“拾取”对话框。依次拾取出口处的下端节点和上端节点两个点,单击“OK”按钮,会弹出“ByNodes”对话框,如图5-140所示,在“Name Define Path Name”后输入路径名称“outlet”,单击“OK”按钮关闭对话框。
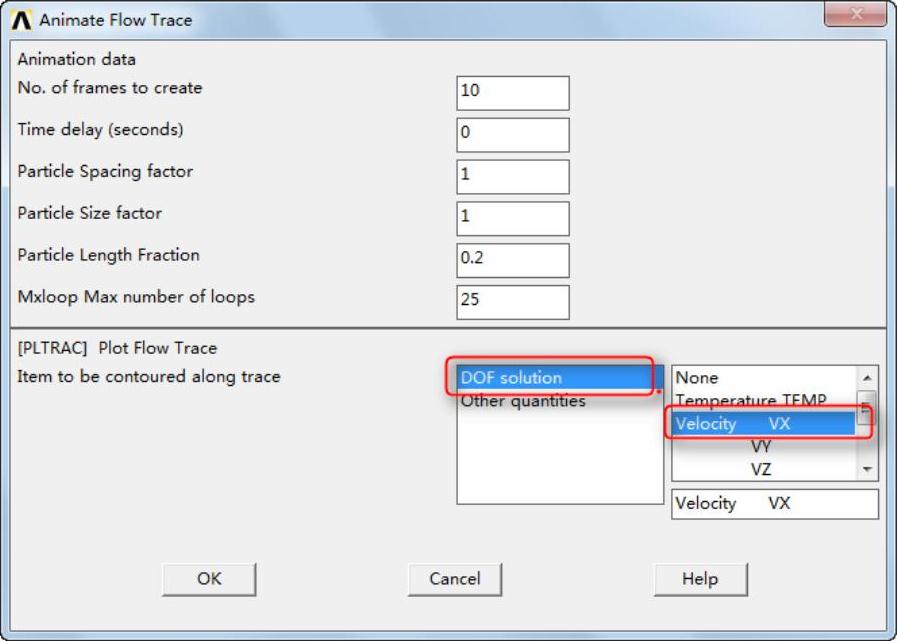
图5-139 “Animate Flow Trace”对话框
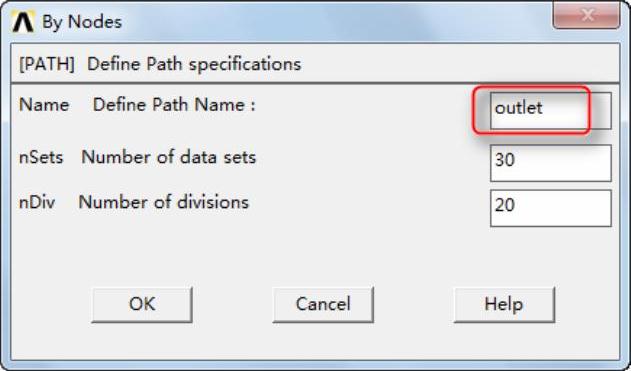
图5-140 “By Nodes”对话框
 依次选择Main Menu→General PostProc→Path Operation→Map onto Path,会弹出“Map Result Items onto Path”对话框,如图5-141所示。在“Lab User label for item”后输入“velocity”,在列表中选择“DOF Solution→Velocity VX”,单击“OK”按钮关闭对话框。
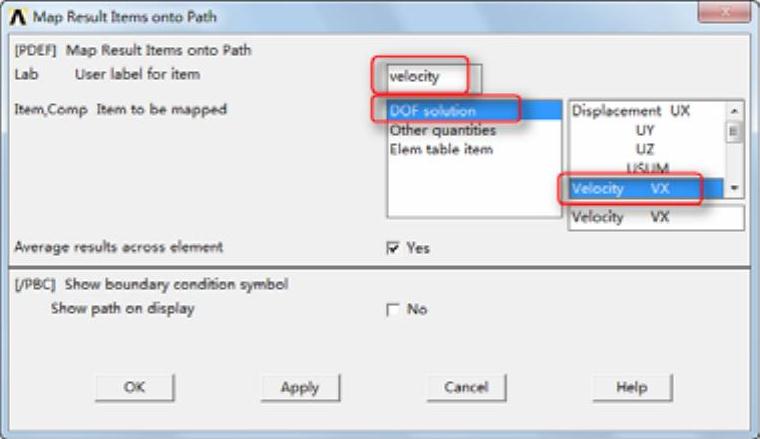
图5-141 Map Result Items onto Path对话框
 依次选择Main Menu→General PostProc→Path Operation→Plot Path Items→On Graph,会弹出“Plot of Path Items On Graph”对话框,如图5-142所示。在列表中选择“velocity”选项,单击“OK”按钮确认,会得到出口处流速的分布,如图5-143所示。
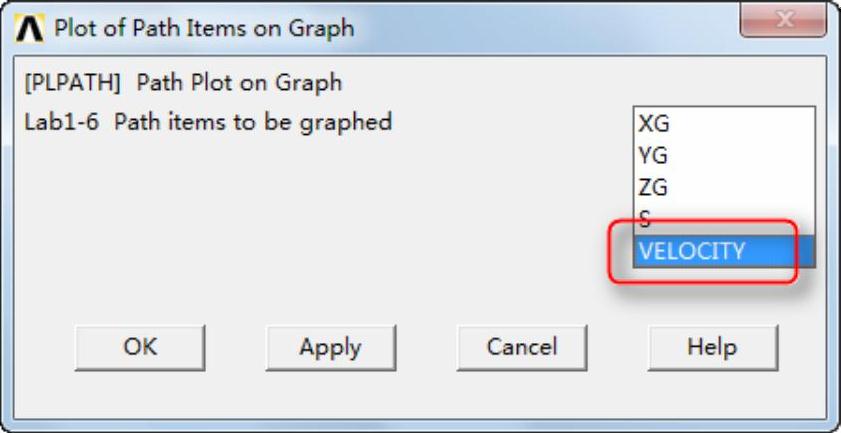
图5-142 “Plot of Path Items on Graph”对话框
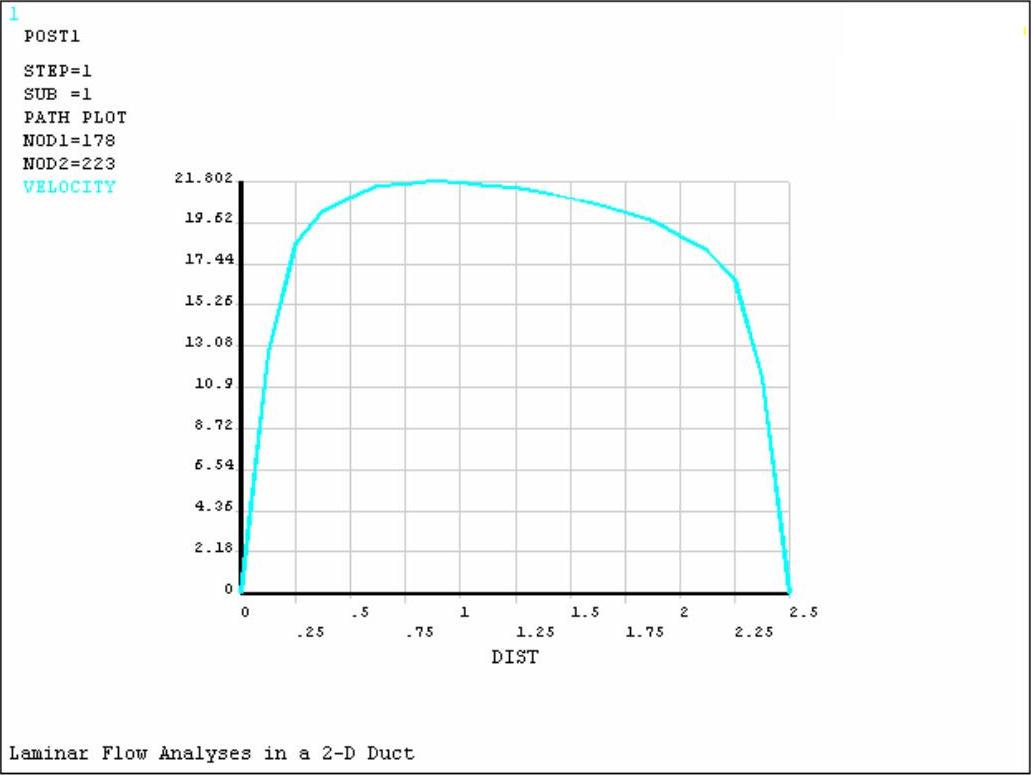
图5-143 出口处流速的分布
免责声明:以上内容源自网络,版权归原作者所有,如有侵犯您的原创版权请告知,我们将尽快删除相关内容。


