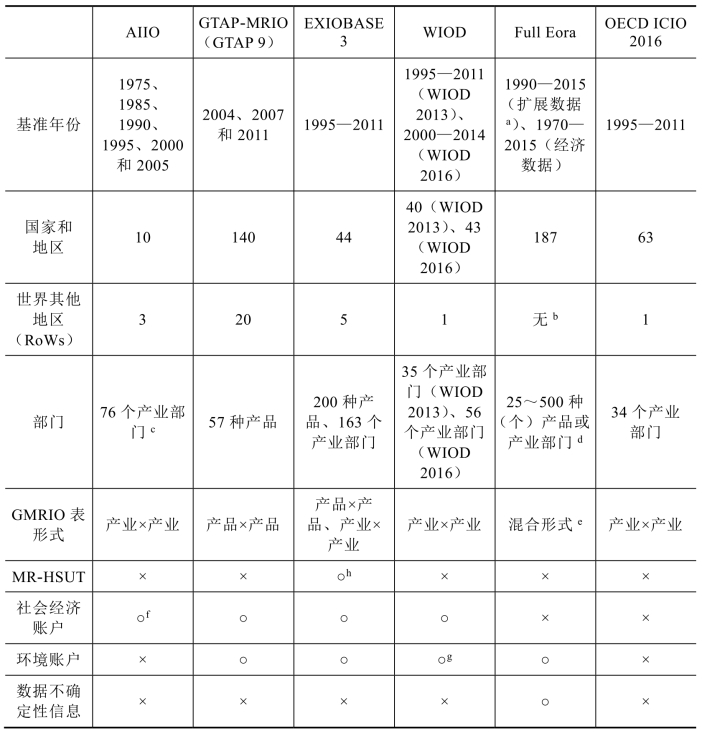
表8.7总结了主要GMRIO数据库的基本信息。从基准年份来看,EXIOBASE 3、WIOD、Full Eora和OECD ICIO等数据库构造了GMRIO表和卫星账户的时间序列数据,有助于分析各种社会、经济和环境指标的动态演变趋势和变化规律,从而更好地为政策制定提供定量基础。其中,WIOD 2016和Full Eora分别覆盖了2000—2014和1990—2015两个时期,数据滞后年限较短,具有较强的时效性。
从数据库覆盖的国家和地区数量来看,由于强调使用官方数据和特别调查数据,AIIO数据库仅包含了 9 个亚洲经济体和美国,不适用于分析全球问题;EXIOBASE 3、WIOD和OECD ICIO同样也选择使用官方数据来源,所覆盖的国家和地区以欧盟、OECD国家为主,因此比较适合分析发达国家地区的政策问题;GTAP-MRIO和Full Eora覆盖了全世界大部分经济体,可以满足不同研究问题的需要,例如在研究贸易对生态多样性的影响时,在贸易隐含碳研究中无足轻重的马达加斯加却是重要的研究对象。
从数据库包含的世界其他地区(RoWs)数量来看,GTAP-MRIO和EXIOBASE 3有多个RoWs,这样可以减小各个RoWs的体量,提高各个RoWs内部的一致性,并且帮助研究人员判断在具体研究中哪些国家和地区可能需要从RoWs中分离出来。
从数据库的部门详尽程度来看,EXIOBASE 3包含了200种产品和163个产业部门,其详尽的部门分类特别适合于将投入产出数据与能源使用、碳排放、水资源使用、土地使用等环境信息结合起来做环境足迹分析。Eora数据库虽然也有较详尽的部门分类,但是各国和地区的部门分类标准和数量差异巨大,因而不适用于部门层面的国际比较分析。其他GMRIO数据库的部门数量在 34 至76 之间,可以满足相关社会和经济问题的研究需要。
从GMRIO表形式来看,多数GMRIO数据库采用了基于“固定产品销售结构”假设的“产业×产业”形式MRIO表。“产业 × 产业”形式MRIO表的优点在于:(1)可以与其他基于产业部门分类的信息结合起来,如劳动力就业信息、产业研发支出等;(2)政策制定往往针对的是产业部门,因而有助于政策分析;(3)基于固定产品销售结构假设将供给使用表转换为投入产出表,可以保证除了“库存变化”项以外不会有负值出现。GTAP-MRIO和EXIOBASE 3提供了基于“产业技术”假设的“产品×产品”形式MRIO表。一些环境账户数据基于产品部门分类,结合“产品×产品”形式的MRIO表可以较为方便地进行环境足迹分析。此外,EXIOBASE 3还提供了采用混合单位计量的全球多区域供给使用表MR-HSUTs,适用于生命周期分析、完全物质需要分析、环境足迹测算等方面的研究。
表8.7 主要全球多区域投入产出数据库比较

注:(1)Full Eora的扩展数据包含环境账户和投入产出数据;(2)Full Eora开发人员认为,该数据库包含187个国家和地区,已经包含绝大部分的全球经济体,故而可以忽略RoW;(3)2000和2005年度AIIO表的部门数量为76个,其余年度部门数量参见表8.1;(4)Full Eora的编制原则是最大可能地保留原始数据信息,故而未统一部门数量和分类标准;(5)为了尽可能地保留原始数据信息,扩大数据库涵盖的国家和部门,Full Eora的MRIO表由供给使用表、“产品×产品”形式投入产出表、“产业×产业”形式投入产出表结合双边贸易数据连接而成,属于混合形式的MRIO表;(6)2000年AIIO表匹配了就业数据,其余年度则无;(7)WIOD 2013的环境账户涵盖了1995—2009年数据,WIOD 2016的环境账户数据尚未公布;(8)EXIOBASE 3提供了2011年采用混合单位计量的全球多区域供给使用表(Multi-Regional Hybrid Supply and Use Tables,MR-HSUTs),表中的有形产品采用质量单位,能源流采用的单位是万亿焦耳,服务则以欧元计量。
从卫星账户来看,GTAP-MRIO、EXIOBASE 3和WIOD 2013都提供了社会经济账户和环境账户数据,因而适用范围更加广泛。AIIO数据库仅包含2000年就业数据并以此作为卫星账户,因而在进行环境问题分析时,需要从其他数据库匹配环境指标数据。OECD ICIO 2016不包含卫星账户,因此面临着类似的问题。
从数据不确定性信息来看,Full Eora是唯一一个匹配了MRIO表和卫星账户数据不确定性信息的GMRIO数据库。通过引入数据的不确定性信息,数据使用人员可以更好地理解数据的潜在假设和限制,也可以通过数据归并得到满足特定数据不确定性要求的数据。
从GMRIO表的数据来源来看,AIIO数据库使用官方数据,并借由特别调查获取进口矩阵信息,因此对区域产业关联和贸易联系有较准确的刻画;GTAP-MRIO数据库的原始数据来源于GTAP用户的志愿提交,在数据可靠性方面略逊一筹;EXIOBAE 3、WIOD和OECD ICIO数据库同样选择使用官方数据来源,因而数据较公开透明;Eora数据库的数据来源较为多元,既有官方统计数据,也有国际组织数据,还有相当比例的国家和地区的投入产出数据通过估计得出,因此数据可靠性也弱于使用官方数据的GMRIO数据库。
从进口矩阵的构建方法来看,多数GMRIO数据库采用“进口同比例”假设拆分进口数据。这一假设不大适用于发展中国家,因为发展中国家用于国内消费和出口产品生产中使用进口中间投入的比例往往差异很大。对此,WIOD估算了中间使用、最终使用和投资等不同使用类别的进口品比例,提高了进口矩阵的准确程度。
综上所述,目前并不存在一个完美的GMRIO数据库。现有GMRIO数据库各有其优缺点。研究人员需要根据具体的研究问题,选择合适的GMRIO数据库。对于现有GMRIO数据库在实证研究中的结果差异,感兴趣的读者可以参考Steen-Olsen et al.(2016)、Owen(2017)、Uchida and Oyamada(2017)、Wieland et al.(2018)等文献。除了本章介绍的数据库,实际上还有一些GMRIO数据库在开发过程中,如YNU-GIO[11](Sato and Shrestha,2014;Shrestha and Sato,2015)、EU IC SUIOTs[12](Eurostat,2016),限于篇幅限制,本书未加以介绍,感兴趣的读者可以查阅相关文献了解。
参考文献
[1] Aguiar,A.,Narayanan,B.,Mcdougall,R.,2016. An overview of the GTAP 9 data base. Journal of Global Economic Analysis 1,181 - 208.
[2] Ahmad,N.,Wang,Z.,Yamano,N.,2013. A three-stage reconciliation method to construct a time series international input-output database,in: Mattoo,A.,Wang,Z.,Wei,S. - J.(Eds.),Trade in value added: Developing new measures of crossborder trade. The World Bank,Washington,DC,USA.
[3] Andrew,R.M.,Peters,G.P.,2013. A multi-region input-output table based on the global trade analysis project database(GTAP-MRIO). Econ. Systems Res. 25,99 - 121.
[4] Beutel,J.,2008. Eurostat manual of supply,use and input-output tables. Office for Official Publications of the European Communities,Luxembourg.
[5] Dietzenbacher,E.,Los,B.,Stehrer,R.,Timmer,M.,de Vries,G.,2013.The construction of world input-output tables in the WIOD project. Econ. Systems Res. 25,71 - 98.
[6] Erumban,A.A.,Gouma,R.,de Vries,G.,de Vries,K.,Timmer,M.,2012. WIOD socio-economic accounts(SEA): Sources and methods.
[7] Eurostat,2016. European union inter-country supply,use and input-output tables(FIGATO tables).
[8] Geschke,A.,Lenzen,M.,Kanemoto,K.,Moran,D.,2011. AISHA: A tool to construct a series of contingency tables,19th International Input-Output Conference(IIOC). International Input-Output Association(IIOA),Alexandria,United States.
[9] Gouma,R.,Chen,W.,Woltjer,P.,Timmer,M.,2018. WIOD socioeconomic accounts 2016: Sources and methods.
[10] Hertwich,E.G.,Peters,G.P.,2009. Carbon footprint of nations: A global,trade-linked analysis. Environmental Science & Technology 43,6414 - 6420.
[11] Inomata,S.,Yamano,N.,Meng,B.,2013. Developing international inputoutput databases: IDE-JETRO and OECD experiences,in: Mattoo,A.,Wang,Z.,Wei,S. - J.(Eds.),Trade in value added: Developing new measures of cross-border trade. The World Bank,Washington,DC,USA.
[12] Jensen,R.C.,1980. The concept of accuracy in regional input-output models.Int. Reg. Sci. Rev. 5,139 - 154.
[13] Johnson,R.C.,2017. Measuring global value chains. National Bureau of Economic Research Working Paper Series No. 24027.
[14] Koopman,R.,Powers,W.,Wang,Z.,Wei,S. - J.,2010. Give credit where credit is due: Tracing value added in global production chains. National Bureau of Economic Research Working Paper Series No. 16426.
[15] Koopman,R.,Wang,Z.,Wei,S. - J.,2014. Tracing value-added and double counting in gross exports. Amer. Econ. Rev. 104,459 - 494.
[16] Kuwamori,H.,Uchida,Y.,Tamamura,C.,2013. Compilation of the 2005 Asian international input-output table.
[17] Lenzen,M.,Gallego,B.,Wood,R.,2009. Matrix balancing under conflicting information. Econ. Systems Res. 21,23 - 44.
[18] Lenzen,M.,Kanemoto,K.,Moran,D.,Geschke,A.,2012. Mapping the structure of the world economy. Environmental Science & Technology 46,8374 - 8381.(https://www.xing528.com)
[19] Lenzen,M.,Moran,D.,Kanemoto,K.,Geschke,A.,2013. Building Eora: A global multi-region intput-output database at high country and sector resolution.Econ. Systems Res. 25,20 - 49.
[20] Lenzen,M.,Wood,R.,Wiedmann,T.,2010. Uncertainty analysis for multi-region input-output models-A case study of the UK’s carbon footprint. Econ. Systems Res. 22,43 - 63.
[21] Meng,B.,Zhang,Y.,Inomata,S.,2013. Compilation and applications of IDE-JETRO’s international input-output tables. Econ. Systems Res. 25,122 - 142.
[22] Merciai,S.,Schmidt,J.,2018. Methodology for the construction of global multi-regional hybrid supply and use tables for the EXIOBASE v3 database. J. Ind. Ecol.22,516 - 531.
[23] OECD-WTO,2012. Trade in value-added: Concepts,methodologies,and challenges(Joint OECD-WTO note).
[24] Owen,A.,2017. Techniques for evaluating the differences in multiregional input-output databases: A comparative evaluation of CO2 consumption-based accounts calculated using Eora,GTAP and WIOD. Springer.
[25] Peters,G.P.,Andrew,R.,Lennox,J.,2011. Constrcution an environmentally-extended multi-regional input-output table using the GTAP database. Econ.Systems Res. 23,131 - 152.
[26] Peters,G.P.,Hertwich,E.G.,2008. CO2 embodied in international trade with implications for global climate policy. Environmental Science & Technology 42,1401 - 1407.
[27] Sato,K.,Shrestha,N.,2014. Global and regional shock transmission: An Asian perspective. CESSA Working Paper 2014 - 04.
[28] Shrestha,N.,Sato,K.,2015. Global financial crisis and shock transmission:Supply - or demand-driven shock? CESSA Working Paper 2015 - 10.
[29] Spinelli,F.,Miroudot,S.,2015. Estimating bilateral trade in services by industry - The EBTSI data set.
[30] Stadler,K.,Wood,R.,Bulavskaya,T.,Södersten,C. - J.,Simas,M.,Schmidt,S.,Usubiaga,A.,Acosta-Fernández,J.,Kuenen,J.,Bruckner,M.,Giljum,S.,Lutter,S.,Merciai,S.,Schmidt,J.H.,Theurl,M.C.,Plutzar,C.,Kastner,T.,Eisenmenger,N.,Erb,K. - H.,Koning,A.,Tukker,A.,2018.EXIOBASE 3: Developing a time series of detailed environmentally extended multi-regional input-output tables. J. Ind. Ecol. 22,502 - 515.
[31] Steen-Olsen,K.,Owen,A.,Barrett,J.,Guan,D.,Hertwich,E.G.,Lenzen,M.,Wiedmann,T.,2016. Accounting for value added embodied in trade and consumption: an intercomparison of global multiregional input-output databases. Econ.Systems Res. 28,78 - 94.
[32] Timmer,M.,Los,B.,Stehrer,R.,de Vries,G.,2016. An anatomy of the global trade slowdown based on the WIOD 2016 release. GGDC Research Memoranda No.162.
[33] Timmer,M.P.,Dietzenbacher,E.,Los,B.,Stehrer,R.,Vries,G.J.,2015. An illustrated user guide to the world input-output database: The case of global automotive production. Rev. Int. Econ. 23,575 - 605.
[34] Uchida,Y.,Oyamada,K.,2017. Evaluating the Asian international inputoutput table in comparison with the three major multiregional input-output tables. IDE Discussion Papers No.663.
[35] Wang,Z.,Wei,S. - J.,Yu,X.,Zhu,K.,2017. Characterizing global value chains: Production length and upstreamness. National Bureau of Economic Research Working Paper Series No. 23261.
[36] Wang,Z.,Wei,S. - J.,Zhu,K.,2013. Quantifying international production sharing at the bilateral and sector levels. National Bureau of Economic Research Working Paper Series No. 19677.
[37] Wieland,H.,Giljum,S.,Bruckner,M.,Owen,A.,Wood,R.,2018.Structural production layer decomposition: a new method to measure differences between MRIO databases for footprint assessments. Econ. Systems Res. 30,61 - 84.
【注释】
[1]参见http://www.ide.go.jp/English/Publish/Books/Io.html。
[2]假设每一种产品的使用结构是固定的,无论它由哪个行业生产。
[3]假设每一个产业都有自己特别的生产技术,无论它生产的产品组合是否与别的产业相同。
[4]参见http://www.wiod.org/otherdata/ADB/ADB_MRIO_SM.pdf。
[5]参见www.worldmrio.com。
[6]最新版本的Eora数据库覆盖的时期已经扩展至1990—2015年。
[7]例如,来自国家和地区官方统计机构的数据被赋予较小的标准差,来自联合国数据库的数据则被赋予较大的标准差;数值微小(较大)的数据被赋予较大(较小)的标准差。
[8]参见http://www.oecd.org/sti/ind/inter-country-input-output-tables.htm。
[9]参见http://www.oecd.org/industry/ind/measuring-trade-in-value-added.htm。
[10]参见http://www.oecd.org/sti/ind/carbondioxideemissionsembodiedininternationaltrade.htm。
[11]参见http://www.recessa.ynu.ac.jp/en/database/ynu-gio/。
[12]参见https://ec.europa.eu/eurostat/web/economic-globalisation/globalisation-macroeconomic-statistics/multi-countrysupply-use-and-input-output-tables/figaro。
免责声明:以上内容源自网络,版权归原作者所有,如有侵犯您的原创版权请告知,我们将尽快删除相关内容。


