根据公式(7.44),在EEBT模型下,国家r向国家s的出口的部门j产品隐含碳![]() 可以表示为:
可以表示为:
![]()
其中, 表示部门j出口占比,es表示国家r向国家s的出口总额。国家r向国家s出口隐含碳ECrs可以重新表示为:

其中,
![]()
表示部门j单位产出所引致的国家r国内碳排放,亦即完全碳排放强度。根据公式(7.66),[0,T]时期国家r向国家s出口隐含碳rs EC算术变化和期末期初比率可以分别做如下分解:

其中,下标total_int表示完全碳排放强度效应,ex_str表示出口结构效应,ex_vol表示出口规模效应。
根据公式(7.67)和(7.68),基于EEBT模型的出口隐含碳指数分解分析模型采用部门视角,关注了经济结构因素中的出口产品结构;相对地,基于EEBT模型的出口隐含碳结构分解分析模型采用经济整体视角,所关注的经济结构因素不仅可以包含出口产品结构因素[1],而且也包含连接生产端和消费端的里昂惕夫产业结构因素。事实上,根据王等(Wang et al.,2017),在理论框架上,SDA模型可以被看作IDA模型的扩展,两类模型的主要差异在于对经济结构因素的处理方式不同。根据7.1.2节相关模型方法,表7.5给出了基于EEBT模型的[0,T]时期国家r向国家s出口隐含碳指数分解分析模型。
表7.5 基于EEBT模型的[0,T]时期国家r向国家s出口隐含碳指数分解分析模型

续表

注:
1. ![]() ,其他类似表达式构造方法相同;
,其他类似表达式构造方法相同;
2. ;
;
3. 。
。
基于MRIO模型,在[0,T]时期,国家r向国家s的出口隐含碳ECrs的算术变化和期末期初比率可以分别做如下分解:

其中,![]() 表示国家r向国家s出口部门j最终产品隐含碳,
表示国家r向国家s出口部门j最终产品隐含碳,![]() 表示国家s部门j最终产品生产活动导致国家r中间产品生产碳排放;rs y表示国家s对国家r最终产品总需求;
表示国家s部门j最终产品生产活动导致国家r中间产品生产碳排放;rs y表示国家s对国家r最终产品总需求; 表示国家s对国家r最终产品需求中的部门j产品占比;
 表示国家r单位最终产品所导致的国内碳排放;ys 表示对国家s最终产品的总需求;
 表示对国家s最终产品需求中的部门j产品占比;
 表示国家s单位最终产品所导致的国家r碳排放。根据公式(7.69),在MRIO模型下,[0, T]时期国家r向国家s出口隐含碳ECps算术变化和期末期初比率可以分别做如下分解:

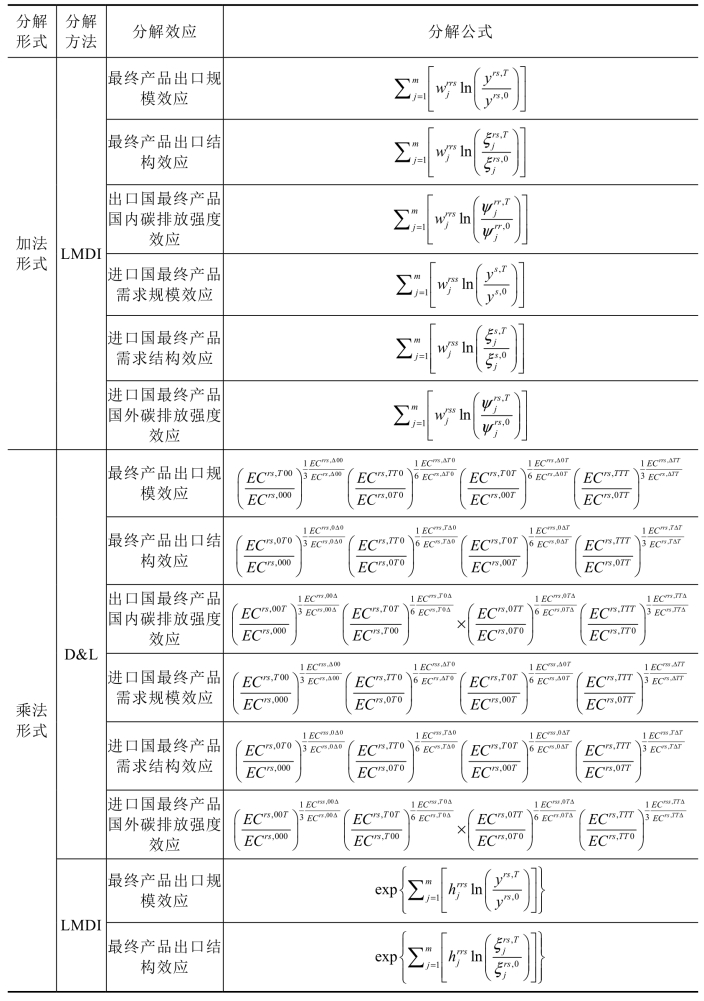
其中,下标fex_vol表示最终产品出口规模效应,fex_str表示最终产品出口结构效应,fd_int表示出口国最终产品国内碳排放强度效应,fd_vol表示进口国最终产品需求规模效应,fd_str表示进口国最终产品需求结构效应,ff_int表示进口国最终产品国外碳排放强度效应。根据7.1.2节的相应内容,表7.6给出了基于MRIO模型的[0,T]时期国家r向国家s出口隐含碳指数分解分析模型。
表7.6 基于MRIO模型的[0,T]时期国家r向国家s出口隐含碳指数分解分析模型

续表

续表

注:
1.  ,其他类似表达式构造方法相同;
2. ;
;
3. ;
;
4. ;
;
5. 。
。
在MRIO模型下,国家r区域p向国家s的出口隐含碳ECps可以表示为:

其中,![]() 表示国家r区域p向国家s出口的区域u部门j碳排放;
表示国家r区域p向国家s出口的区域u部门j碳排放; 是区域p部门j单位产出所引致的区域p碳排放占比,反映了区域间后向产业碳关联结构。根据公式(7.69),在MRIO模型下,[0,T]时期国家r区域p向国家s出口隐含碳ps EC算术变化和期末期初比率可以分别做如下分解:

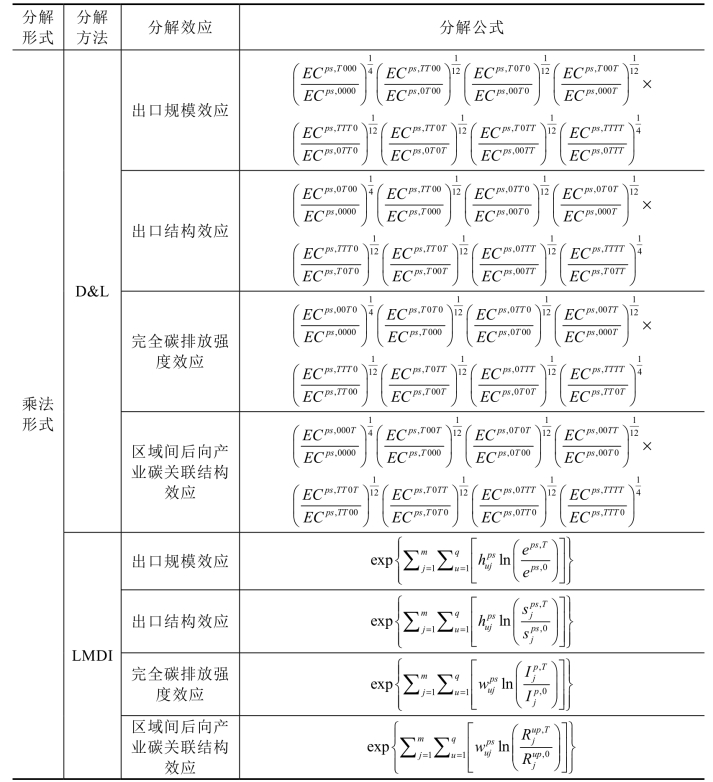
其中,下标ex_vol表示出口规模效应,ex_str表示出口结构效应,total_int表示完全碳排放强度效应,cbl_str表示区域间后向产业碳关联结构效应。根据7.1.2节的相应内容,表7.7给出了基于MRIO模型的[0,T]时期国家r区域p向国家s出口隐含碳指数分解分析模型。
对于出口隐含碳指数分解分析的链式分析模型、空间分解分析模型和归因分析方法,感兴趣的读者可以自行推导,本书不再赘述。
表7.7 基于MRIO模型的[0,T]时期国家r区域p向国家s出口隐含碳指数分解分析模型

续表

注:
1. ![]() ,其他类似表达式构造方法相同;
,其他类似表达式构造方法相同;
2. ;
;
3. 。
。
参考文献(https://www.xing528.com)
[1] Ang,B.W.,2015. LMDI decomposition approach: A guide for implementation.Energy Policy 86,233 - 238.
[2] Ang,B.W.,Choi,K. - H.,1997. Decomposition of aggregate energy and gas emission intensities for industry: A refined Divisia index method. The Energy Journal Volume18,59 - 73.
[3] Ang,B.W.,Liu,F.L.,2001. A new energy decomposition method: perfect in decomposition and consistent in aggregation. Energy 26,537 - 548.
[4] Ang,B.W.,Liu,F.L.,Chung,H. - S.,2004. A generalized Fisher index approach to energy decomposition analysis. Energy Econ. 26,757 - 763.
[5] Ang,B.W.,Xu,X.Y.,Su,B.,2015. Multi-country comparisons of energy performance: The index decomposition analysis approach. Energy Econ. 47,68 - 76.
[6] Ang,B.W.,Zhang,F.Q.,2000. A survey of index decomposition analysis in energy and environmental studies. Energy 25,1149 - 1176.
[7] Ang,B.W.,Zhang,F.Q.,Choi,K. - H.,1998. Factorizing changes in energy and environmental indicators through decomposition. Energy 23,489 - 495.
[8] Balk,B.M.,2004. Decomposition of Fisher indices. Econ. Letters 82.
[9] Choi,K. - H.,Ang,B.W.,2012. Attribution of changes in Divisia real energy intensity index—An extension to index decomposition analysis. Energy Econ. 34,171 - 176.
[10] Chung,H. - S.,Rhee,H. - C.,2001. A residual-free decomposition of the sources of carbon dioxide emissions: A case of the Korean industries. Energy 26,15 - 30.
[11] De Boer,P.,2008. Additive structural decomposition analysis and index number theory: An empirical application of the Montgomery decomposition. Econ. Systems Res. 20,97 - 109.
[12] De Boer,P.,2009. Multiplicative decomposition and index number theory: An empirical application fo the Sato-Vartia Decomposition. Econ. Systems Res. 21,163 - 174.
[13] Dietzenbacher,E.,Los,B.,1998. Structural decomposition techniques: Sense and sensitivity. Econ. Systems Res. 10,307 - 324.
[14] Du,H.,Guo,J.,Mao,G.,Smith,A.M.,Wang,X.,Wang,Y.,2011.CO2 emissions embodied in China-US trade: Input-output analysis based on the emergy/dollar ratio. Energy Policy 39,5980 - 5987.
[15] Hoekstra,R.,van den Bergh,J.C.J.M.,2003. Comparing structural decomposition analysis and index. Energy Econ. 25,39 - 64.
[16] Liu,H.,Xi,Y.,Guo,J.e.,Li,X.,2010. Energy embodied in the international trade of China: An energy input-output analysis. Energy Policy 38,3957 - 3964.
[17] Liu,Z.,Davis,S.J.,Feng,K.,Hubacek,K.,Liang,S.,Anadon,L.D.,Chen,B.,Liu,J.,Yan,J.,Guan,D.,2015. Targeted opportunities to address the climate-trade dilemma in China. Nature Climate Change 6,201.
[18] Miller,R.E.,Blair,P.D.,2009. Input-output analysis: Foundations and extensions. Cambridge University Press.
[19] Mu,A.,2012. Index decomposition analysis: Some methodological issues.National University of Singapore.
[20] Reinsdorf,M.B.,Diewert,W.E.,Ehemann,C.,2002. Additive decompositions for Fisher,Törnqvist and geometric mean indexes. J. Econ. Soc. Meas. 28,51-61.
[21] Rose,A.,Casler,S.,1996. Input-output structural decomposition analysis: A critical appraisal. Econ. Systems Res. 8,33 - 62.
[22] Rose,A.,Chen,C.Y.,1991. Sources of change in energy use in the U.S.economy,1972 - 1982: A structural decomposition analysis. Resources Energy 13,1 - 21.
[23] Sato,M.,2014. Embodied carbon in trade: A survey of the empirical literature.J. Econ. Surveys 28,831 - 861.
[24] Su,B.,Ang,B.W.,2012a. Structural decomposition analysis applied to energy and emissions: Aggregation issues. Econ. Systems Res. 24,299 - 317.
[25] Su,B.,Ang,B.W.,2012b. Structural decomposition analysis applied to energy and emissions: Some methodological developments. Energy Econ. 34,177 - 188.
[26] Su,B.,Ang,B.W.,2016. Multi-region comparisons of emission performance:The structural decomposition analysis approach. Ecol. Indic. 67,78 - 87.
[27] Su,B.,Thomson,E.,2016. China’s carbon emissions embodied in(normal and processing)exports and their driving forces,2006 - 2012. Energy Econ. 59,414 - 422.
[28] Sun,J.W.,1998. Changes in energy consumption and energy intensity: A complete decomposition model. Energy Econ. 20,85 - 100.
[29] Tian,X.,Chang,M.,Lin,C.,Tanikawa,H.,2014. China’s carbon footprint: A regional perspective on the effect of transitions in consumption and production patterns. Appl. Energy 123,19 - 28.
[30] Wang,H.,Ang,B.W.,2018. Assessing the role of international trade in global CO2 emissions: An index decomposition analysis approach. Appl. Energy 218,146 - 158.
[31] Wang,H.,Ang,B.W.,Su,B.,2017. Assessing drivers of economy-wide energy use and emissions: IDA versus SDA. Energy Policy 107,585 - 599.
[32] Wu,R.,Geng,Y.,Dong,H.,Fujita,T.,Tian,X.,2016. Changes of CO2 emissions embodied in China-Japan trade: drivers and implications. Journal of Cleaner Production 112,4151 - 4158.
[33] Xu,Y.,Dietzenbacher,E.,2014. A structural decomposition analysis of the emissions embodied in trade. Ecolog. Econ. 101,10 - 20.
[34] Yan,Y.,Yang,L.,2010. China’s foreign trade and climate change: A case study of CO2 emissions. Energy Policy 38,350 - 356.
[35] Zhao,Y.,Wang,S.,Yang,J.,Zhang,Z.,Liu,Y.,2016. Input-output analysis of carbon emissions embodied in China-Japan trade. Appl. Econ. 48,1515 - 1529.
[36] Zhao,Y.,Zhang,Z.,Wang,S.,Wang,S.,2014. CO2 emissions embodied in China’s foreign trade: An investigation from the perspective of global vertical specialization. China & World Economy 22,102 - 120.
[37] Zhou,X.,Zhou,D.,Wang,Q.,2018. How does information and communication technology affect China’s energy intensity? A three-tier structural decomposition analysis. Energy 151,748 - 759.
【注释】
[1]7.2.2节的出口隐含碳结构分解分析模型没有将出口效应进一步分解为出口规模效应和出口结构效应,感兴趣的读者可以根据7.1.2节分解分析的一般模型自行推导。
免责声明:以上内容源自网络,版权归原作者所有,如有侵犯您的原创版权请告知,我们将尽快删除相关内容。


